S3 method to create a box plot of numeric variables for an exportClass object
Source:R/as_export_class.R
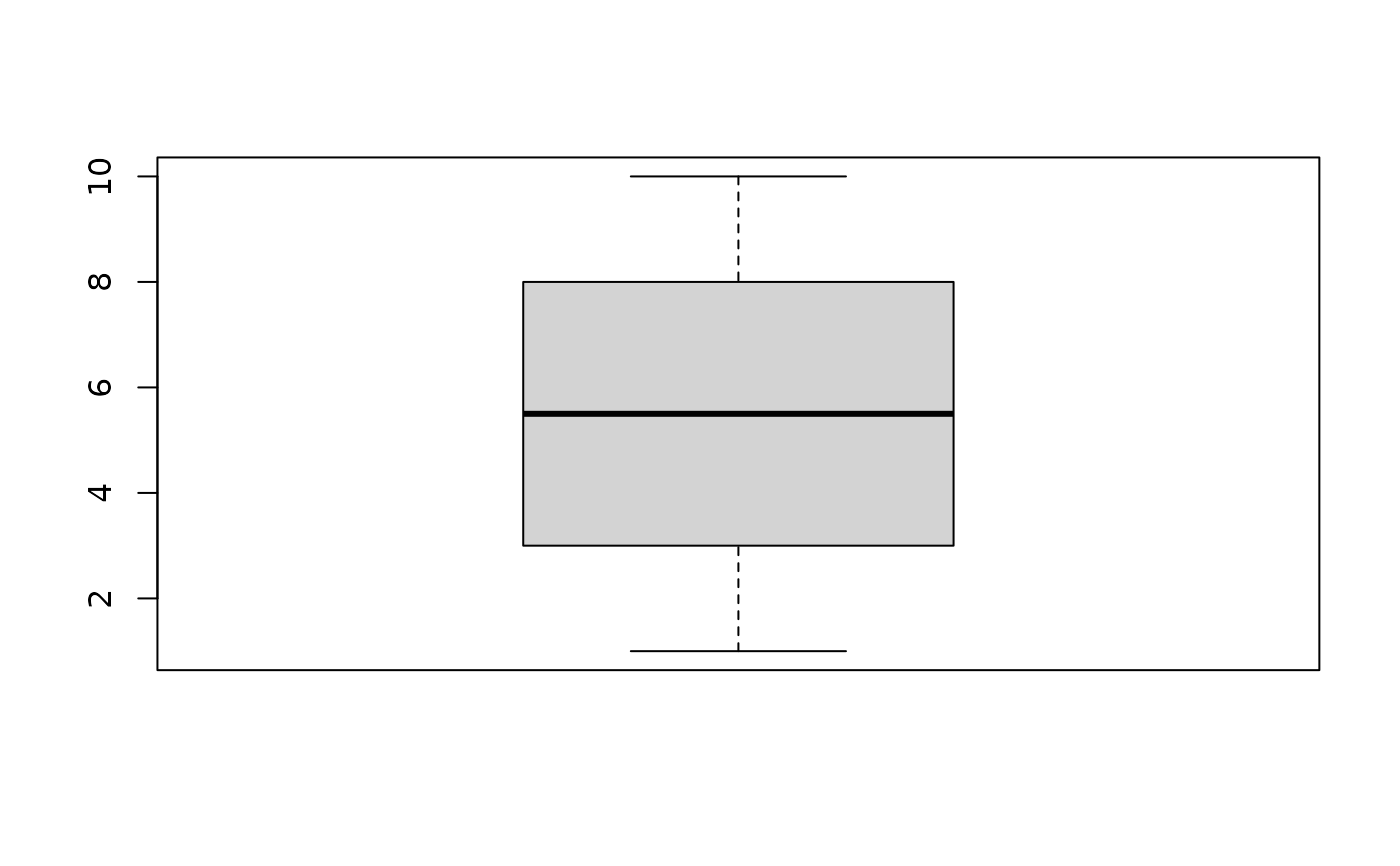
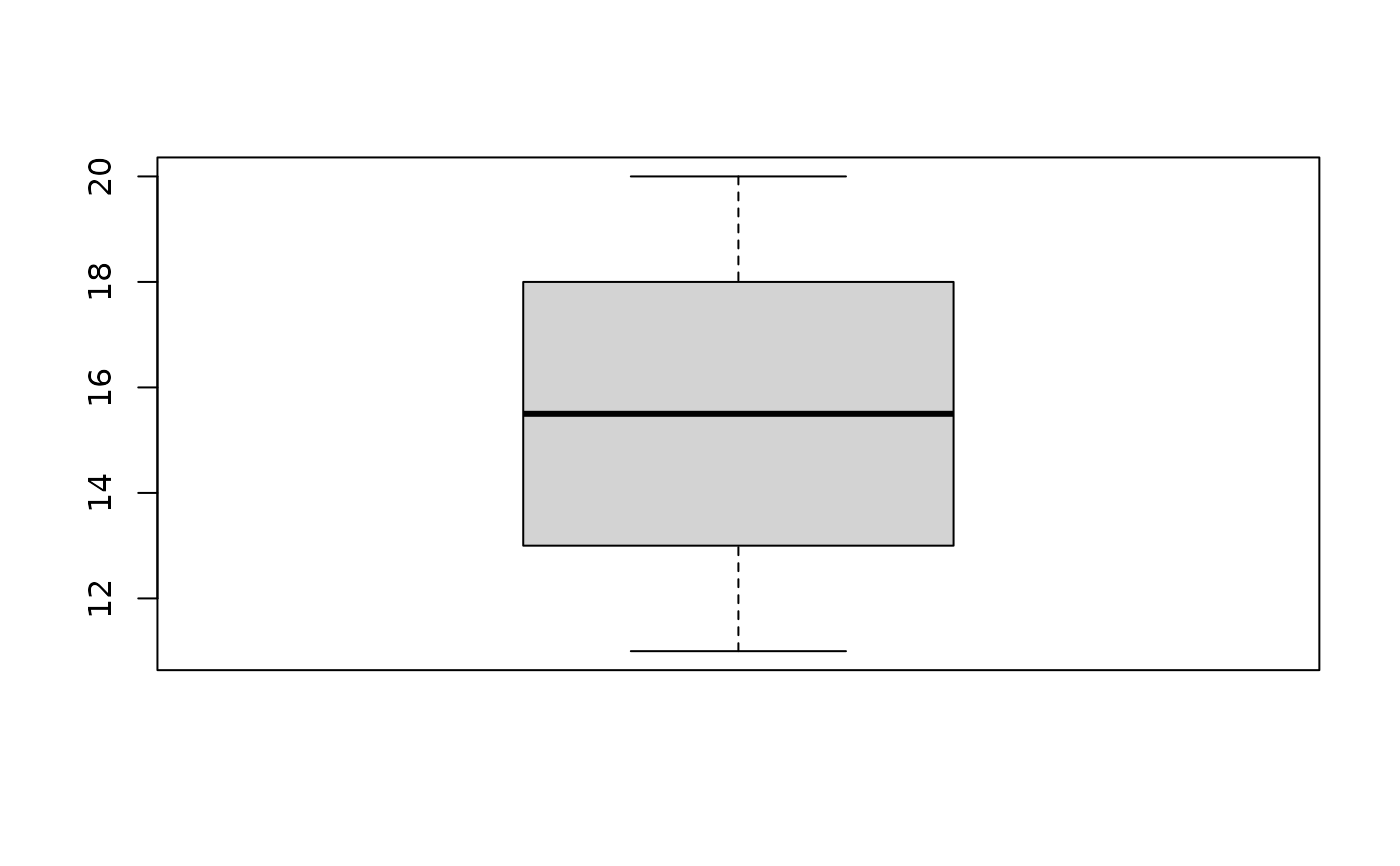
boxplot_summary.RdThis function generates a box plot for the numeric variables in a exportClass object.
Usage
boxplot_summary(x, useGGplot2 = FALSE, ...)

# S3 method for class 'exportClass'
boxplot_summary(x, useGGplot2 = FALSE, ...)Value
A box plot visualizing the numeric variables.
A ggplot2 plot object if useGGplot2 is TRUE, or a base R boxplot list invisibly otherwise
Examples
dt <- data.table::data.table(q1 = 1:10, q2 = 11:20)
vlabs <- data.table::data.table(
VariableName = c("q1", "q2"),
QuestionText = c("Question 1", "Question 2")
)
ec <- exportClass(dt, varLabels = vlabs)
boxplot_summary(ec)
 #> $q1
$stats
#> [,1]
#> [1,] 1.0
#> [2,] 3.0
#> [3,] 5.5
#> [4,] 8.0
#> [5,] 10.0
#>
#> $q1$n
#> [1] 10
#>
#> $q1$conf
#> [,1]
#> [1,] 3.001801
#> [2,] 7.998199
#>
#> $q1$out
#> numeric(0)
#>
#> $q1$group
#> numeric(0)
#>
#> $q1$names
#> [1] "1"
#>
#>
#> $q2
#> $q2$stats
#> [,1]
#> [1,] 11.0
#> [2,] 13.0
#> [3,] 15.5
#> [4,] 18.0
#> [5,] 20.0
#>
#> $q2$n
#> [1] 10
#>
#> $q2$conf
#> [,1]
#> [1,] 13.0018
#> [2,] 17.9982
#>
#> $q2$out
#> numeric(0)
#>
#> $q2$group
#> numeric(0)
#>
#> $q2$names
#> [1] "1"
#>
#>